TME Comparison
A qualitative evaluation of the tumour microenvironments between biopsy and cystectomy bladder cancer samples.
Goal
Conduct a preliminary analysis to demonstrate the application of machine learning in an automated pipeline to study the tumour microenvironment in matched biopsy and cystectomy bladder cancer tissue samples.
Result
The proteomic profiles of biopsy tissues seem to follow a very siimilar distribution as the matched cystectomy tissues. The similar expression profiles indicate the possibility for pathologists to deduce the same information obtained from a cystectomy sample, but from a biopsy sample instead. In doing so, clinicians would be able to administer proper treatment to the patient without having to wait for a cystectomy.
An important issue surrounding bladder cancers is the delay in administering adequate treatment for the patient. A patient will have an initial transurethral resection of bladder tumour which involves a biopsy, and then followed up with a cystectomy, which is used to determine the treatment plan. The time between the two procedures can be extensive and results in unwanted progression of the cancer before the patient can undergo the cystectomy. If a pathologist is able to deduce the information obtained through a cystectomy sample from the biopsy sample instead, this issue will become redundant.
In the past, CD8+ T cells have been shown to be associated with MIBC patients’ overall survival. Here, we analyze and compare the proteomic profiles of the biopsy and cystectomy tissues to identify possible similarities, with a specific interest in CD8+ T cell expressions. We take an unsupervised approach and perform a qualitative analysis using a deep autoencoder. The autoencoder is used to reduce the dimensionality of the data and the resulting distribution is evaluated for similarities.
Data & Pre-processing
There are 30 biopsy samples from 15 bladder cancer patients along with 30 matched cystectomy samples for each patient. Protein expression data for 22 protein markers was obtained and cell masks were generated using TITAN’s segmentation function and mean intensity information of each cell was obtained. The mean intensity of a protein within a given cell indicates the protein expression levels. The resulting dataset is a matrix where each row represents a cell and each column contains the mean expression level of a given protein for that cell. This dataset was normalized and outliers were removed before model training. Outliers were determined as data points lying greater than 4 standard deviations away from the mean. These points likely contain background noise and may negatively impact the comparison. We used PhenoGraph on the log-transformed dataset to cluster phenotypically similar cells phenograph. A pathologist then used the protein expression levels of each cluster to manually annotate the phenotype of the cells within a given cluster.
Network
The model used is an autoencoder for an unsupervised approach in order to obtain a qualitative comparison of the distribution of cell types between biopsy and cystectomy tissue samples. An autoencoder was chosen since it allows for visualization of the data in a lower dimensional space through use of the encoding layer, referred to herein as the latent space. The latent space ultimately provides a more informative understanding of the dataset in its entirety.
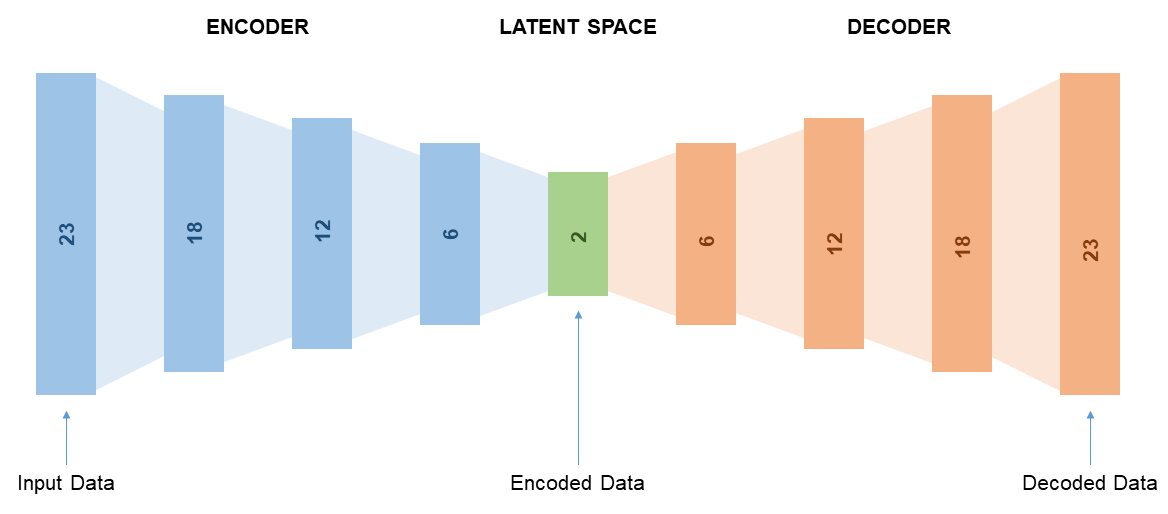
Each layer of the autoencoder uses a ReLU activation function, with the final encoding and decoding layer using a linear and sigmoid activation function respectively. The network was trained using the Adam optimization function with a learning rate of 5e-5. The mean squared error was calculated and back-propagated throughout training of the network. A latent space of dimension size 2 was used in order for optimal visualization of data results.
1
2
3
4
5
6
7
8
9
10
11
12
13
14
15
16
17
18
19
20
     adam = tf.keras.optimizers.Adam(learning_rate=0.00005)
    bottleneck_size = 2 # number of dimensions to view latent space in; same as "code size"
    input_data = Input(shape=(23,)) # number of columns

    encoded = Dense(18, activation='relu')(input_data)
    encoded = Dense(12, activation='relu')(encoded)
    encoded = Dense(6, activation='relu')(encoded)
    encoded = Dense(bottleneck_size, activation='linear')(encoded)
    encoder = Model(input_data, encoded)

    encoded_input = Input(shape=(bottleneck_size,))
    decoded = Dense(6, activation='relu')(encoded_input)
    decoded = Dense(12, activation='relu')(decoded)
    decoded = Dense(18, activation='relu')(decoded)
    decoded = Dense(23, activation='sigmoid')(decoded)
    decoder = Model(encoded_input, decoded)

    output_data = decoder(encoder(input_data))
    ae = Model(input_data, output_data)
    ae.compile(optimizer=adam, loss='binary_crossentropy') # using binary cross entropy since input values are in range [0,1]
Experiments
The dataset was split into training and validation sets through random stratification based on cell type. SMOTE was then used to over-sample the training set in order to balance the classes for better model training. The autoencoder was trained on the training set while validating with the validation set. In an effort to prevent overfitting, early stopping with a patience of 10 was incorporated to halt model training based on the validation loss. The accuracy of the autoencoder reconstruction was evaluated and validated by visually analyzing the differences between the decoded data and the true data. Once validated, the latent space is thoroughly investigated to determine how the biopsy and cystectomy tissue samples compare between each other.
Network Validation
The autoencoder trained for 203 epochs and resulted in a validation loss of 0.065. In order to validate the accuracy of the reconstruction, we calculated and plotted the percent error of the reconstructed values based on each feature range.
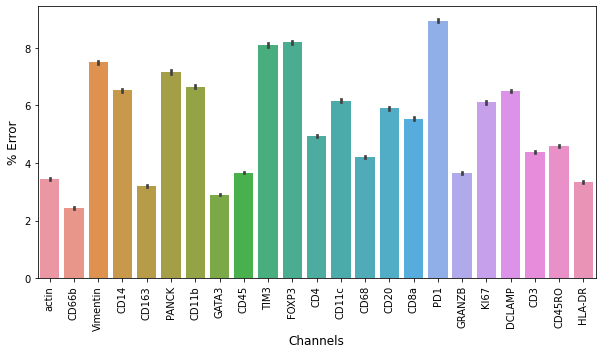
The median percent error of the predicted data points for all features is 3.1\%. Overall, the reconstruction of data remained fairly similar to the true data, indicating effective performance of the autoencoder.
Latent Space Evaluation
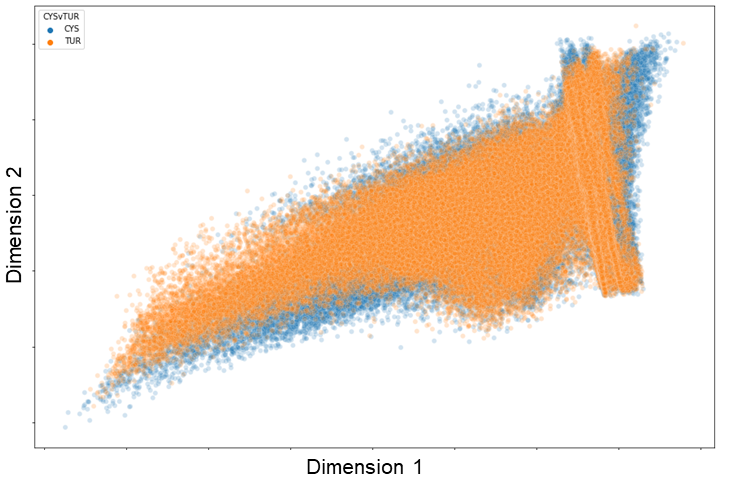
The data points are coloured based on whether they are cells found in the biopsy or cystectomy tissue. As shown, there is significant overlap of the distribution of the data points between both tissue sample types. When represented in two dimensions, cells in both biopsy and cystectomy tissues fall along the same distribution. This would indicate that the protein expression between the two tissue types are relatively similar. In order to further evaluate the similarities, we look at the latent space of specific cell types individually.
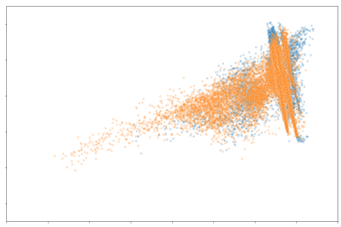
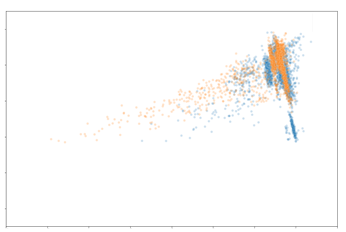
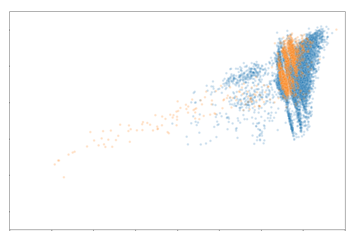
Evidently, the distribution of macrophages and CD8+ T cells are very comparable between the biopsy and cystectomy tissue. Based on these findings, we can deduce that the protein expression of macrophages and CD8+ T cells in a patient’s biopsy sample may be similar to their cystectomy sample. As mentioned earlier, CD8+ T cells have been linked to correlating with MIBC patients’ prognosis. The similarity of CD8+ T cell expression between the biopsy and cystectomy tissues is promising and promotes the possibility of the biopsy CD8+ T cell information to be used as a surrogate of the cystectomy tissue. The distribution of CD4+ T cells has slight overlap although not as significant as the macrophages and CD8+ T cells. This likely indicates that CD4+ T cell expression in a biopsy sample may not be informative of the expected expression of these cells in the matched cystectomy sample. In the past, however, CD4+ T cell content has been shown to have an effect on survival in MIBC patients. Thus, it would be beneficial to investigate this further.
NOTE: This dataset contains samples from only 15 patients overall, so it is impractical to make any definitive biological claims with our analyses. The work in this chapter is very preliminary and mainly provides an overview of what kind of expression profile can be expected from biopsy and cystectomy tissue. With a larger dataset, we would be able to validate the distributions of the biopsy and cystectomy samples to confirm the similarities seen.