TITAN
Image processing & analysis software for IMC data
This work was published in Cytometry Part A and presented at the 2021 Imaging Network Ontario conference.
Goal
Develop a tool that can provide end-to-end analysis of imaging mass cytometry data and improve upon the current software.
Result
Developed TITAN, which provides a step-by-step, user-centered workflow for visualization, segmentation, and analysis. It mitigates the shortcomings of current analysis pipelines and improves efficiency.
Imaging mass cytometry (IMC) is a powerful tissue imaging technology that improves upon traditional imaging methods. It’s capable of outputting a large amount of data, however the current analysis methods are fairly preliminary. Currently, the analytical pipeline is as follows:
- Export raw data using MCD Viewer
- Import images from MCD Viewer into CellProfiler for cell segmentation
- Export generated masks from CellProfiler to the analysis software histoCat
- Export resulting data for external analyses if necessary
In order to complete these tasks, three separate software - endorsed by the manufacturers of the Hyperion™ - are needed and require the unnecessary exportation of partial data results.
Although these software are the standard for analysis of IMC data, they are lacking in utility and require using multiple software for each of the tasks of visualization, segmentation, and analysis. In addition to issues in efficiency, there are certain pitfalls within the functionality of the software themselves, identified by users of these software.
TITAN was developed within a free open-source software platform - 3D Slicer - for the purpose of addressing pitfalls and inefficienceis in the existing workflows for IMC analysis. It’s compatible with both multi-channel text files and single-channel TIFF images of IMC data as inputs and provides an end-to-end pipeline for exploration and quantification of IMC data in a single environment.
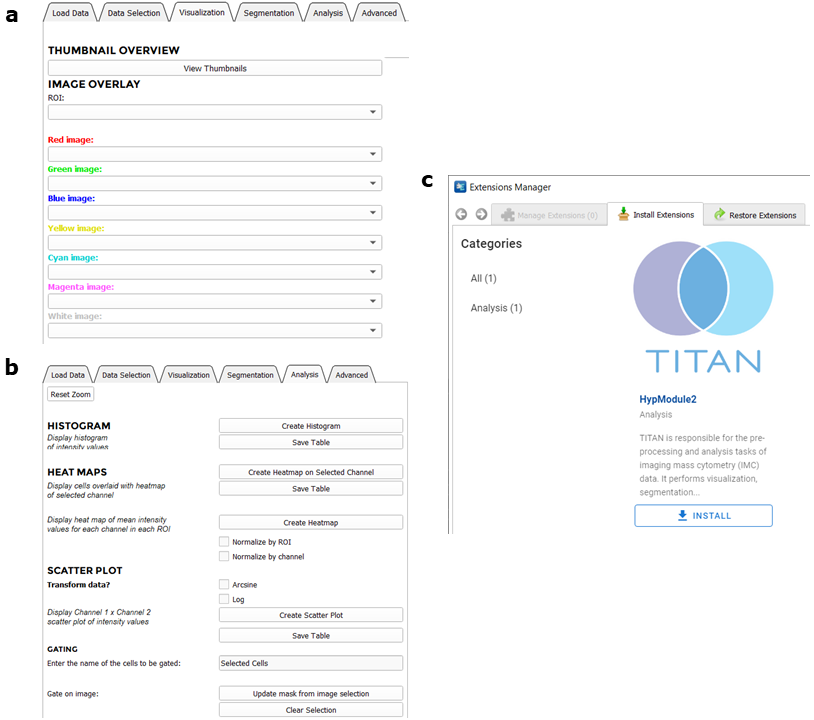
TITAN uses several well-documented Python libraries including Python Imaging Library, SimpleITK, matplotlib, and scikit-learn. It is open-source and publicly available through its Github repository along with detailed documentation and tutorials.
- Visualization
- Segmentation
- Analysis
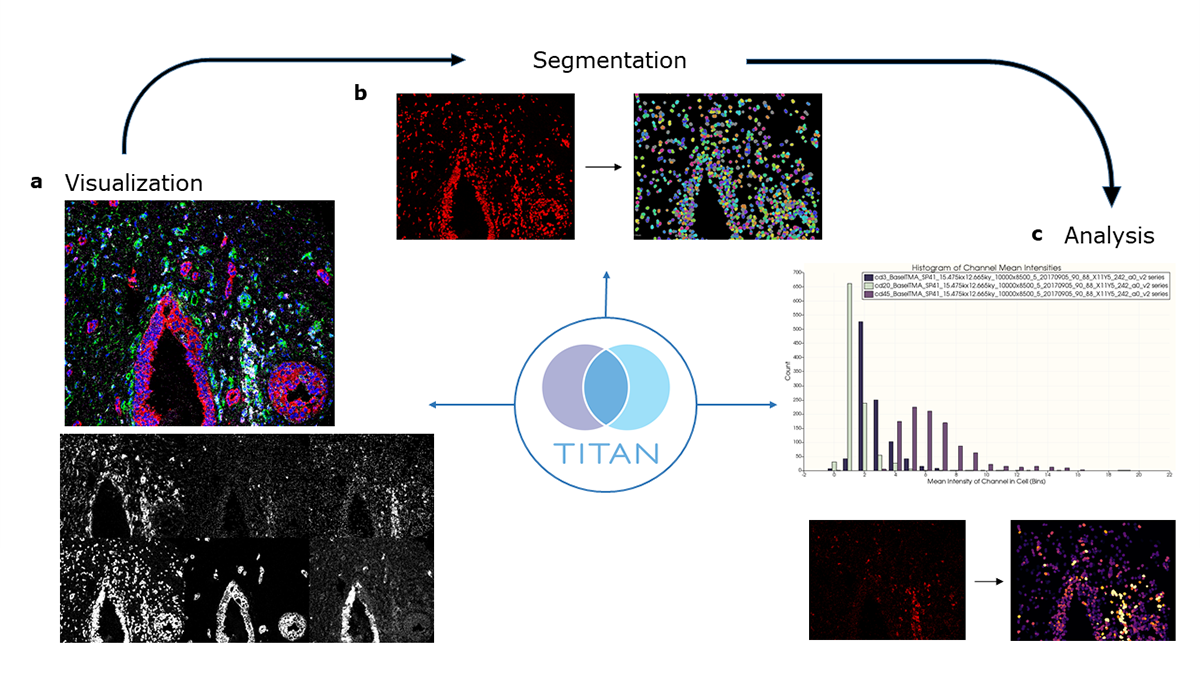
After importing IMC data in text or image format, the user can view individual protein channels as well as an overlay of multiple channels at once. Users can then segment the nucleus channel into a cell mask, which is required for single-cell feature extraction and analysis. Once the cell mask is created, the user can produce a variety of quantitative plots that provide statistical information about the data.
Data Importation
TITAN allows the user to import either raw text files, which are generated during acquisition, or TIFF image files of the individual channels. The text file for an ROI contains the pixel information including location and intensity of each protein channel within a given ROI. If importing the raw text file of each ROI, TITAN will convert the file into individual channel images based on the pixel values and use the generated images for downstream functions. This ultimately removes the need of MCD Viewer, which typically requires an MCD file. There is also the option of importing 8-bit TIFF image files of each channel, for situations where the user may not possess the raw text file. The user can import these files directly into TITAN.
Visualization
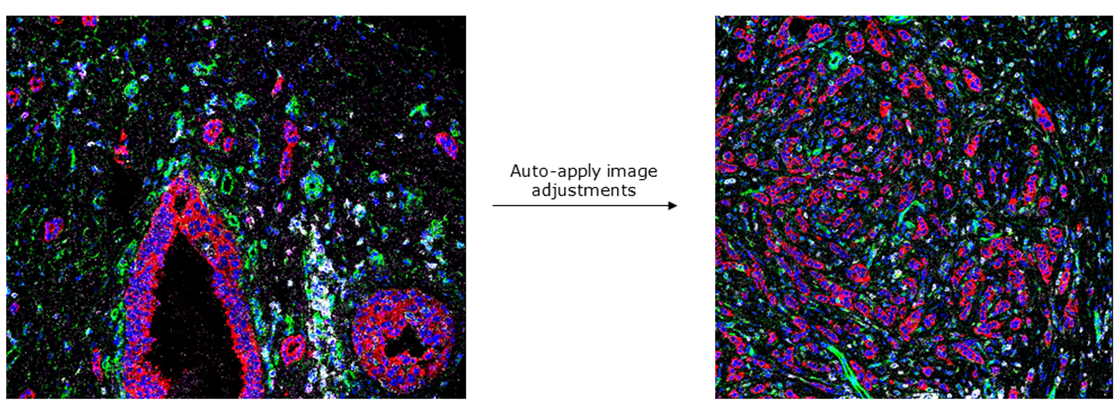
TITAN provides a thumbnail overview of all single-channel images within a given acquired IMC ROI, providing users the ability to assess staining easily and qualitatively. TITAN also allows for the visualization and overlay of up to seven false-coloured channels simultaneously for each ROI, which can be used to generate publication quality figures. An advantage of TITAN compared with MCD Viewer is that, with TITAN, the user is able to manually threshold images or perform automated colour scaling – a feature provided through 3D Slicer. These adjustments can be applied globally to the entire ROI, or locally based on a user-selected region of the ROI. This functionality allows users to optimize the brightness/contrast of multi-channel images interactively and conveniently. Furthermore, TITAN enables users to retain the adjustment parameters for a selected ROI and apply it to all other ROIs to achieve standardized and comparable visualizations across a dataset, shown here:
Segmentation
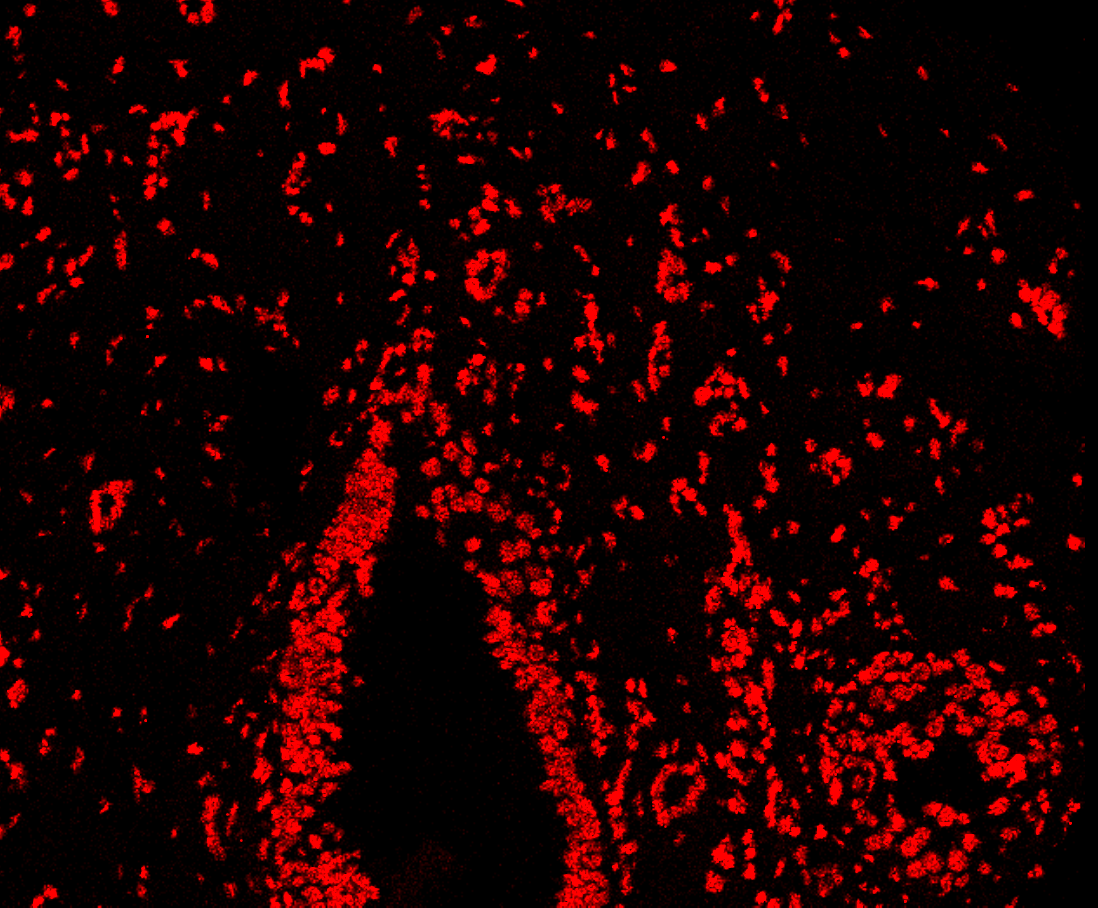
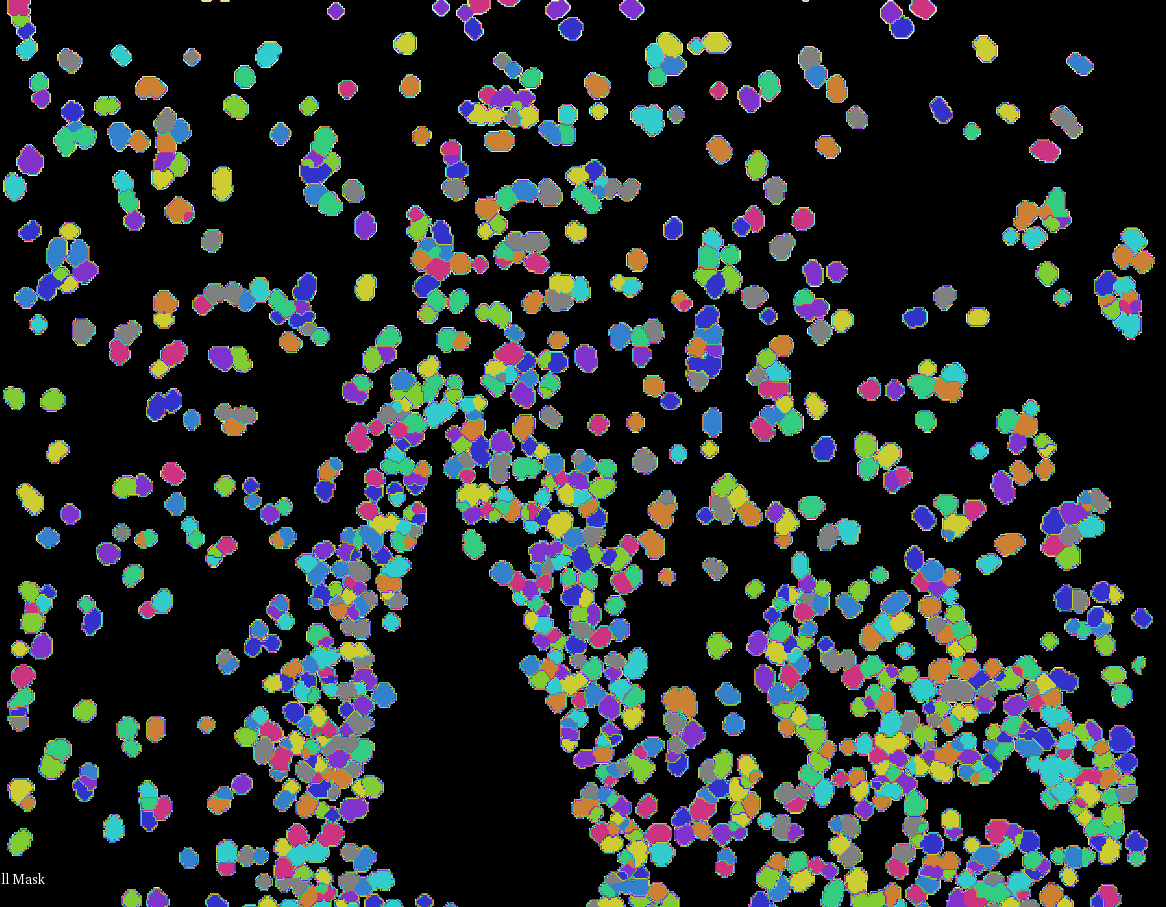
Beyond visualization, IMC enables proteomic imaging at subcellular resolution, thus allowing for single cell-level phenotyping and characterization of tissues. Delineation and segmentation of individual cells within ROIs is a critical step in any IMC data analysis pipeline. In order to segment this nucleus channel, TITAN utilizes a watershed algorithm and morphological image processing to create the initial nucleus mask. When cell segmentation is complete, the total number of cells segmented within each ROI is reported, which is an essential variable for further analysis. Notably, TITAN generates cell masks for multiple ROIs simultaneously and efficiently.
Analysis
TITAN contains simple analysis functions including the generation of histograms, scatter plots, and heat maps of cell features, as well as more computationally complex methods such as dimensionality reduction and clustering functions for cell features.
Following cell segmentation, cell-level mean intensities can be extracted from multi-channel data by calculating the mean intensity of each protein channel within each cell. TITAN is also then capable of exporting these data in spreadsheets, which can be used in external applications as well. This feature provides the user the flexibility to perform downstream analyses of single-cell data in their preferred program or in-house pipeline(s).
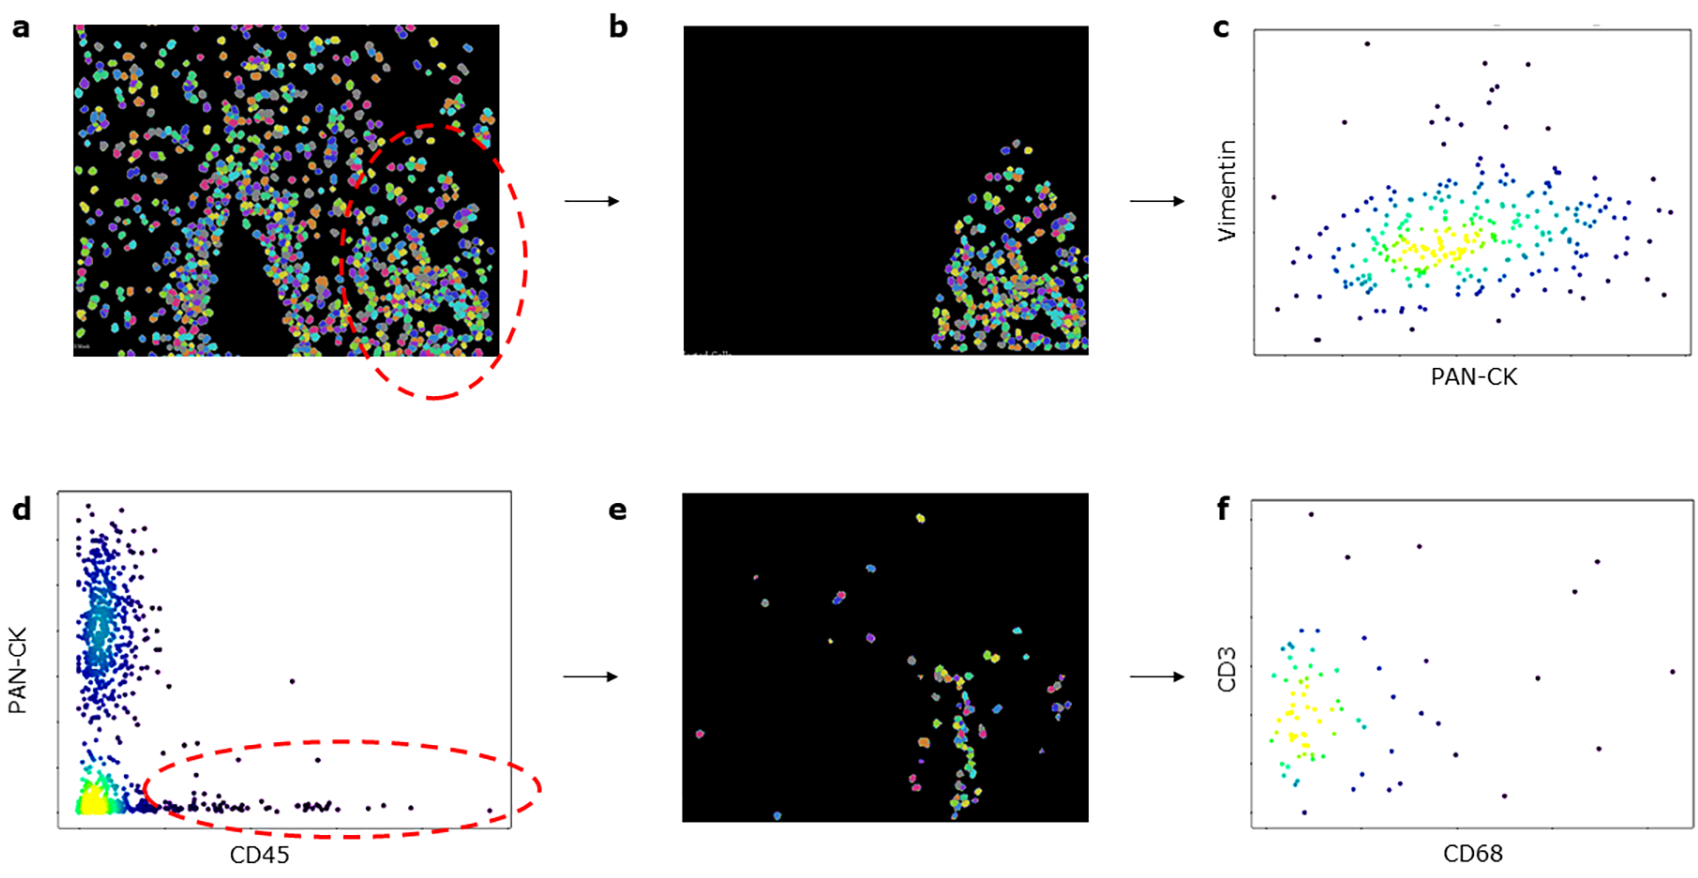
Using the scatter plots produced by TITAN, a manual gating function was implemented. This function allows users to manually gate cell populations based on the hierarchical expression proteins in a two-by-two manner, comparable to how hierarchical gating of cell flow cytometry data is performed. To gate, the user selects two channels for the scatter plot and selects the cells of interest. When the user creates the gated area, a new cell mask containing only the selected cells is displayed and the user has the option to continue gating the images into successive generations. TITAN’s gating feature will be familiar to users experienced with flow cytometry analysis and will enable manual identification and enumeration of cell populations based on marker expression.
Summary of Features
| Feature | My software | Manufacturer Software | ||
|---|---|---|---|---|
| TITAN | MCD Viewer | CellProfiler | histoCAT | |
| Thumbnail view | X | X | ||
| Image Visualization | X | X | X | |
| Automated colour scaling | X | |||
| Reading of multi-channel text files | X | X | ||
| Mask creation for all ROI at once | X | X | ||
| Basic mean intensity plots | X | X | ||
| Gating | X | X | ||
| Dimensionality reduction | X | X | ||
| Clustering functions | X | |||
| Export raw data of cell mean intensities | X | |||