Cancer Prognosis Prediction
A machine learning pipeline for the predictive analysis of IMC data, including a novel augmentation approach.
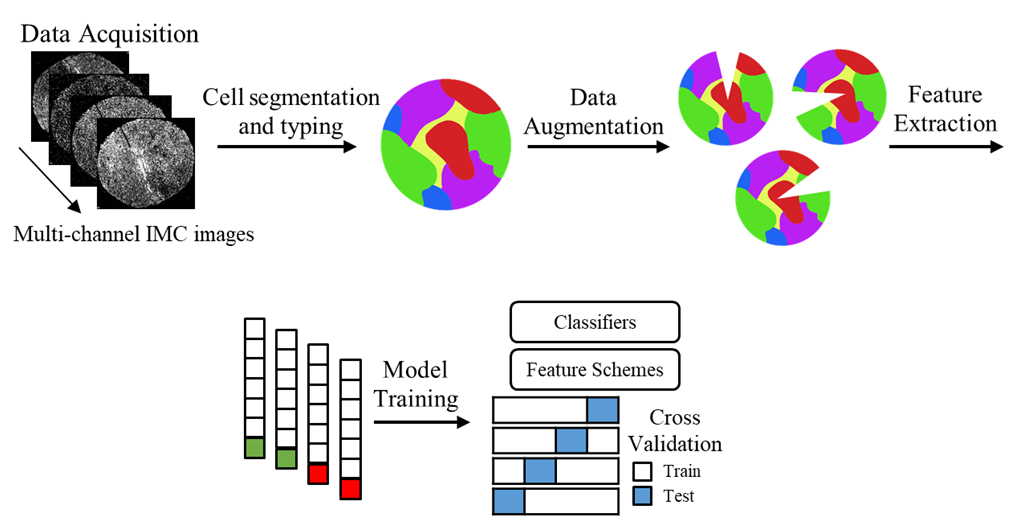
This work was presented and published in 2021 IEEE EMBS International Conference on Biomedical and Health Informatics (BHI).
Goal
Current studies of IMC analysis in the literature use simple statistical approaches. Here, we want to take advantage of the high-throughput nature of imaging mass cytometry data by developing a machine learning-based analysis pipeline.
Result
Developed a standardized machine learning-based analysis pipeline for IMC data for predicting various clinical outcomes of a cancer patient. We also introduced a novel augmentation approach that is specific to IMC data.
Introduction
Both tumour cells and the tumor microenvironemnt (TME) are important considerations when evaluating various cancers at the tissue level. With time, cancer cells evolve and are able to evade destruction by cells of the immune system, resulting in the formation of a tumor. Because of this, it’s important to obtain a better understanding of the various cell types within the TME, since they may contribute to tumor progression.
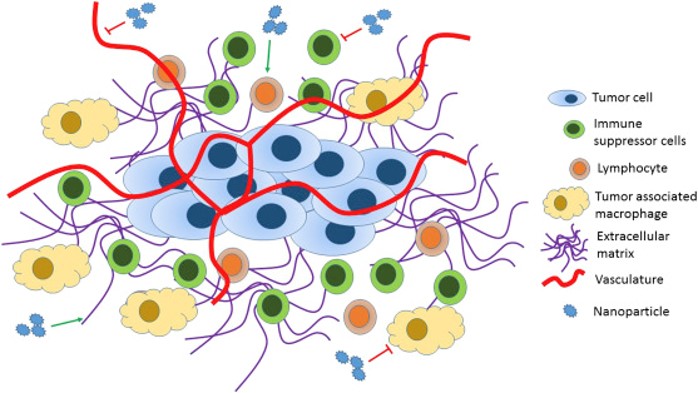
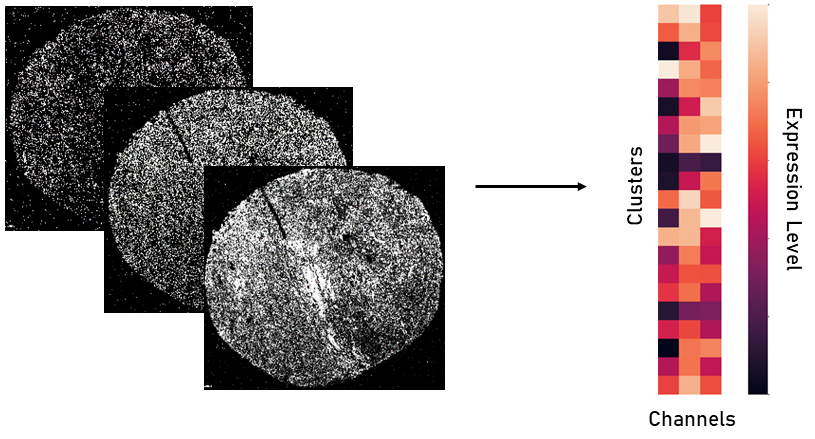
For this project, we do this using the HyperionTM imaging system, which is an imaging mass cytometry (IMC) technology capable of high-throughput imaging of cells and proteins in situ. It produces multi-channel images per tissue sample, where each channel highlights the expression level of a given protein. Based on these expression levels, we can then identify the different cell types in the sample. IMC data have been used in cancer analysis studies in the past, however since it is a relatively new technology, these studies are limited and use regular statistical approaches rather than machine learning (ML) to estimate clinical outcomes. Hence, there’s a much needed urgency to leverage the quantitative nature of this technology.
The goal of the task here is to develop an end-to-end pipeline for ML-based analysis of IMC multi-channel data including a novel cell-level augmentation approach to increase data diversity, hence the generalizability of ML models. To demonstrate the utility of the proposed pipeline, we studied the association of the TME with various clinical parameters in a cohort of patients with muscle invasive bladder cancer (MIBC). We designed several experiments with signatures of IMC data and classification approaches and demonstrated that the combination of cell types found within the TME show promise as a foundation for future clinical research in this field.
Note: You can find the code in this Github repository.
The Data
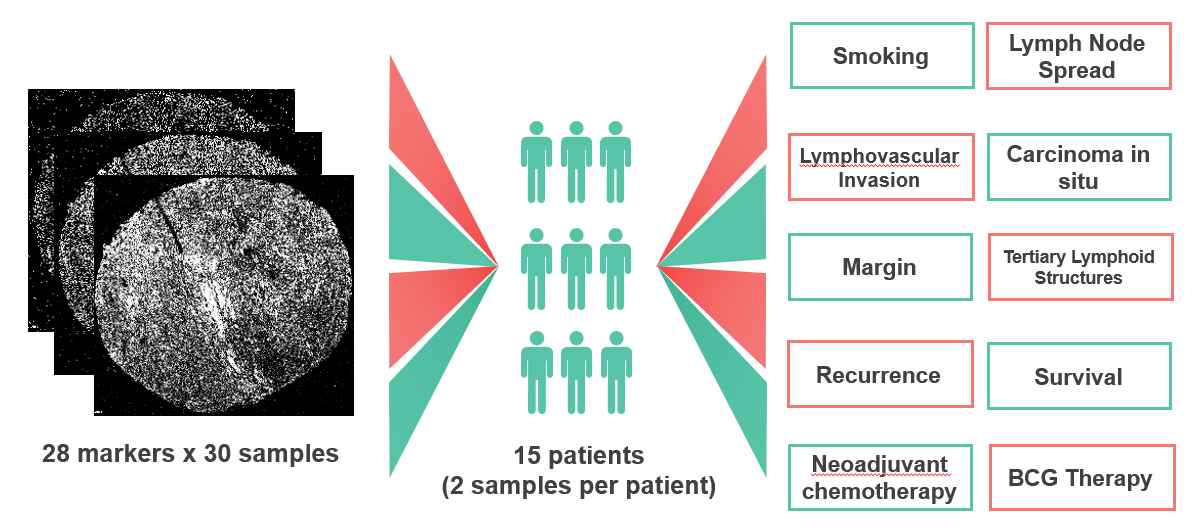
We used 30 tissue samples collected from 15 MIBC patients who underwent a cystectomy (removal of the bladder). For each patient, 10 binary (yes/no) clinical parameters were also collected, including smoking, lymph node spread (LN), and other prognostic features. The tissue samples were stained with 28 protein markers and imaged using the HyperionTM, creating a multi-channel image where each channel represents the expression of a given protein. This expression information is then used by a pathologist to identify the cell types within each sample, explained in detail in Data Pre-Processing. The proportions of each cell type for a given sample are then represented as a vector and form the features that will be used for ML experiments.
Data Pre-Processing
In order to get the protein expression of each individual cell, we first need to segment the cells. To do this, we used the IMC processing and analysis software I developed, TITAN. Once the cells were segmented and we got a resulting cell mask for each sample, we identified the average protein expression for each protein within each cell. This represents the expression of the given protein for that cell, meaning each cell was now represented by 28 protein expressions.
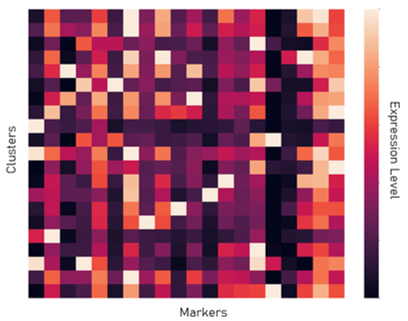
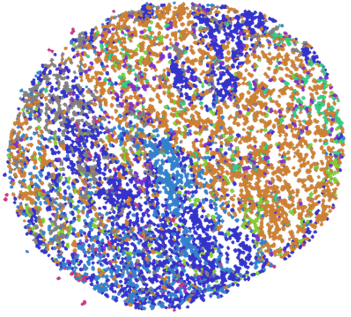
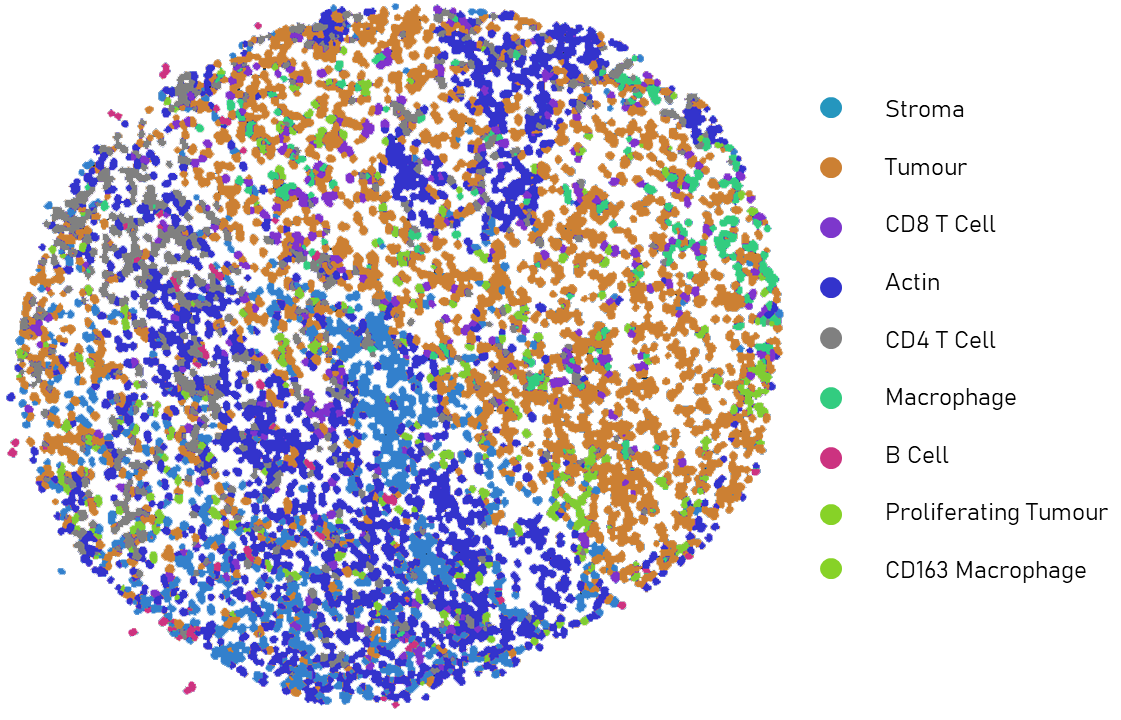
Once we have the overall protein expression information for each cell, we can use that information to identify the type of each cell. For example, if one cell expresses a large amount of the protein CD8, it likely means that the cell is a CD8 T cell. To do this, we used PhenoGraph clustering to identify groups of cells within a sample that have similar protein expression. With this, millions of cells can be represented within tens of clusters. Then, using the resulting clusters, a pathologist annotates the cell type of each cluster based on the protein expressions.
Data Augmentation
With medical data specifically, it has been a longstanding challenge to acquire data from large numbers of subjects. While ML requires data points in the thousands, most patient cohorts are only in the tens. Therefore, proper data augmentation becomes crucial to enable appropriate learning from the data. In IMC images, the protein expressions are measured for each individual cell in the image. For each cell, the averaged pixel intensities within the cell corresponds to its protein expression. Therefore, normal image augmenting techniques like rotations and flips would not work. Though a rotation or flip would change the spatial location of the pixels in relation to the whole image, the pixel intensities within each cell would remain unchanged. Thus, a proper IMC data augmentation technique is necessary.
We developed a novel cell-level spatial augmentation approach called sector elimination. For each tissue sample, we suggest to exclude all cells within a randomly selected 30 degree spatial pie section of the images. This process was randomly repeated 50 times for each of the tissue samples. After augmenting, the proportions of each cell type within a sample was calculated and used as the features for that sample.

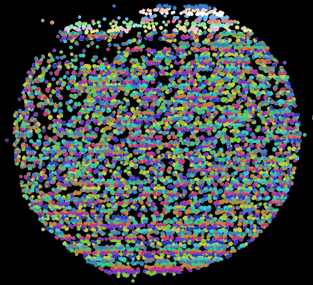
To validate this augmentation method, we projected features representing the proportion of cells that we extracted from the original tissue images along with those from their augmented partial versions to a 2D t-SNE space.
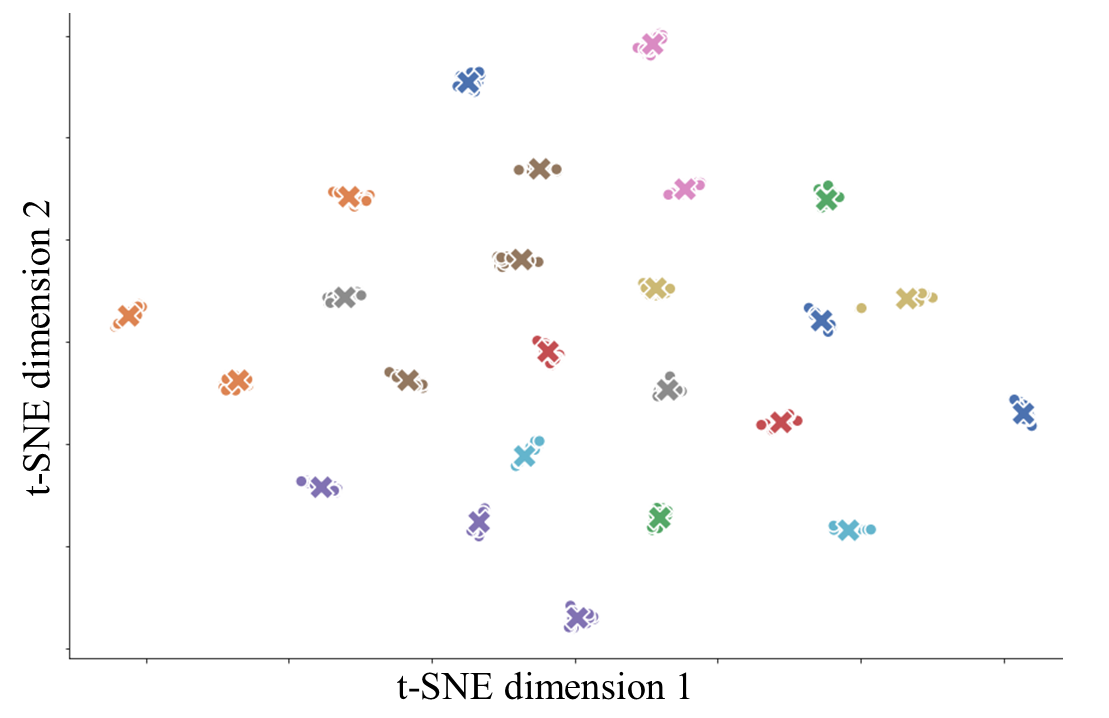
The plot is labelled and coloured by tissue samples and the features from original images are marked with “x”. As shown, the augmented data contains enough variability from the original tissue sample, while remaining similar enough to not compromise the strength of the labels. This lends itself well for the proposed augmentation approach to boost model training.
Although having more patients would be preferred in order to draw and clinical conclusions with high significance, our augmentation method will at least allow for ML analysis on small patient cohort data at some capacity - a notable step forward since until now, there has not been a standardized method of augmenting IMC data. This augmentation can be applied to any kind of multi-channel sub-cellular imaging data for different types of diseases.
Feature Scoring
We used different classification models to evaluate TME association with various clinical labels, shown in Table 1. The features representing the proportion of different cell types were ranked using an ANOVA F-score statistic:
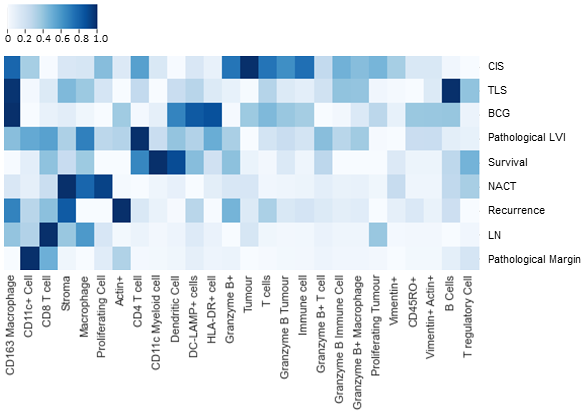
The heat map is grouped by the level of significance of features for the different labels and the scores are normalized for better visualization. Higher scores indicate higher associations of the specific cell types with the given label.
The heat map shows that B cells were relevant to the resence of TLS. Notably, TLS are primarily composed of B cells and thus, this association appears to have biological relevance. In addition, CD8+ T and actin+ cells were recognized to be relevant to recurrence risk. In a past study, increased frequency of CD8+ T cells at the invasive margin in MIBC was found to be associated with prolonged overall survival. Actin+ has shown to play a role in cancer progression through modulation of gene expression. It’s typically found mostly in muscle cells, including the thick muscular wall of the bladder, so these results are not entirely unexpected given that the definition of MIBC is tumor spread into the muscle layer of the bladder wall. Finally, we found that CD163+ macrophages were relevant to prior BCG exposure. BCG is an immunotherapy given to patients with non-muscle invasive bladder cancer (NMIBC), often a precursor to MIBC. There is evidence that CD163+ macrophages in NMIBC are associated with BCG failure, and it is notable that patients in our cohort with prior BCG exposure for their NMIBC diagnosis experienced BCG failure since they progressed to MIBC.
ML Experiments
We used logistic regression (LR), random forest (RF), decision tree (DT), k-nearest neighbour (KNN), and an ensemble of all four models, in a 4-fold cross validation configuration, to validate the performance of varying numbers of top ranked features. For each classifier, the default parameters were used. During fold generation, care was taken to ensure that all data samples from a single patient remained in the same fold. We also used Synthetic Minority Over-sampling Technique (SMOTE) to balance the data, such that each fold contained an equivalent amount of the label we were approximating. The cross validation for each classifier was repeated 50 times - each time with different, randomly generated folds - and the average accuracy of the classifiers on the test fold data in all runs was reported. Based on the results of the experiments, we decided on the optimal number of ranked features, along with the top performing classifier, for each label:
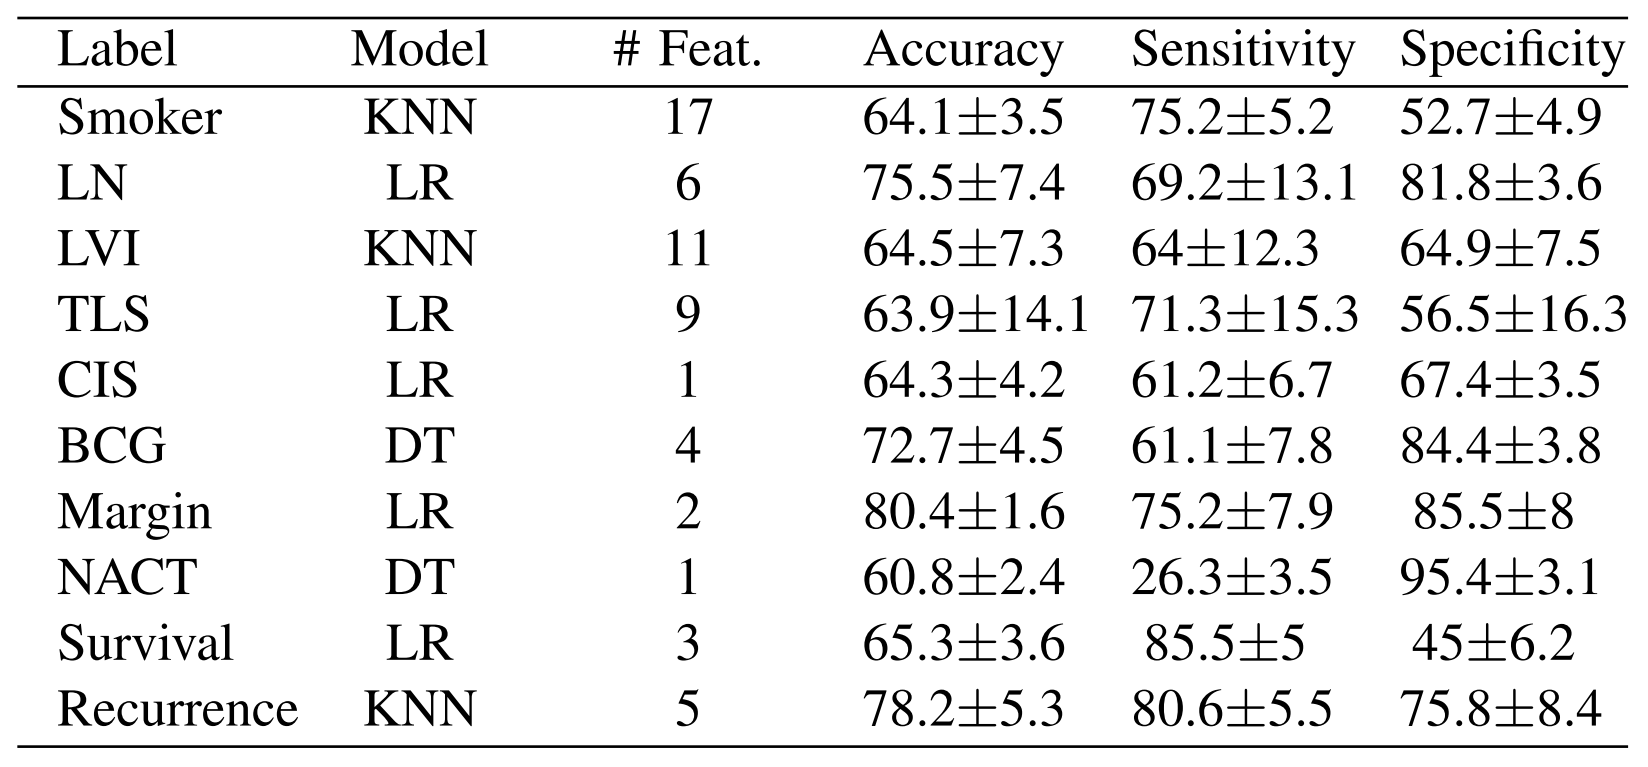
These results illustrate the potential for ML to be used in a predictive setting. Additionally, we repeated the ML analyses using the original data without any augmentation to compare with our proposed augmentation approach. Overall, the performance of these models on the original data without any augmentation was lower:
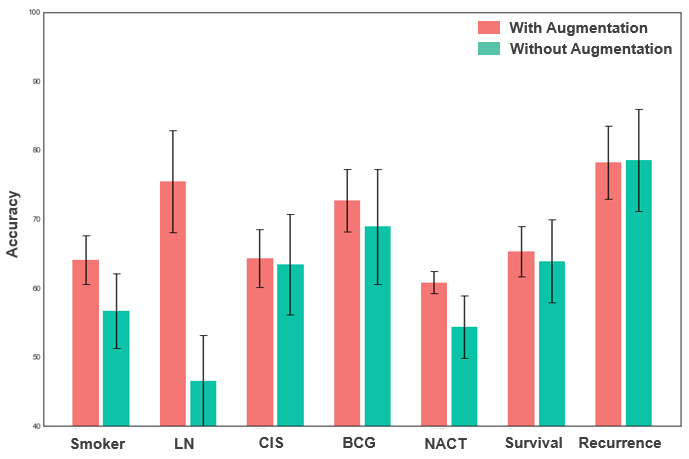
For instance, the accuracy when estimating smoker status, LN, and NACT were 56.7±5.4%, 46.5±6.7%, and 54.4±4.5 respectively. For these labels, we could see that augmentation improved the model performance in a statistically significant way (p<0.001). For the other labels where performance was not improved significantly, we observed that standard deviation was much higher when the model was run without the augmented data. This indicates that without the augmented data, the model is more sensitive to the distribution of data within folds. Thus, our proposed augmentation seems to positively affects the training of the ML classifiers. Overall, our results show promise for sector elimination augmentation to be further researched and eventually applied in larger clinical studies.
Summary
We’ve introduced a robust ML pipeline for the analysis of high-throughput IMC data - a powerful imaging technology that can provide an in-depth profile of numerous cell types. We’ve validated the use of this pipeline through cystectomy tissues from a pilot cohort of MIBC patients. We utilized the proposed pipeline to demonstrate how the TME may be associated with different clinical parameters, which can be considered as an important basis for further clinical investigations. We also introduced a novel method for augmenting IMC data at the cell level, which is essential for any type of AI-related study considering the limitation in clinical data collection. The performance of ML classifiers when using our augmented data compared to only the original data is significantly higher, which further emphasizes the importance of our proposed augmentation method and the value of developing it further. With a more robust data set, this pipeline has the potential to be used for clinical outcome prediction and biomarker identification. In the future, we hope to delve deeper into the analysis of rich IMC data with larger subsets of patients. This work only scratches the surface of what is possible with HyperionTM, but it is a promising start. The large amount of data generated by HyperionTM is ideal for deep learning analyses, specifically, and is an exciting application for further studies with this MIBC data.